This article goes through the basic steps of using the map shown below as a reusable interactive map component. It is intended to be a news map that can be published on very short notice but can also be used as a general purpose map. This tutorial contains one map where the content is in the geojson format.
Newsmap_GEOJSON.zip
If you want to use any of these features you must use this map.
Centering and zooming the map.
Setting the map centre and zoom level is how you decide what the user will see. Consider your audience and how well you think they will know the area shown in the map. If an earthquake hit Indonesia and I was targeting a Norwegian audience I would use a much lower zoom level to show more of the surroundings, I would probably include Australia and India on the map to help the user place the incident in the world. If the audience was in Indonesia I would instead show the affected region assuming they know basic geography about their own country. The following code is on line 73 in the file. Alter the lat & long values to what you want. You can use google maps to get some coordinates, or you can activate the function at line 128 by disabling the block comments.
let map = L.map('mapid').setView([59.924657, 10.728278], 14);Add an initial title and a description.
The title should be very specific for the map. If this map is part of an article beware of potentially repeating information in the map and the article. Try to make the map have its own unique information that relates to geography and movements within an area. The initial title and description in this map are visible when the user first enters the map, but when the user clicks a feature in the map that text will be replaced. You can use the initial title and description as a guide for the user. Alter the title on line 58 and the description on line 59.
<h3 id="mapTitle">Map title</h3>
<p id="mapDescription">Initial map description. This textbox is dynamic and will change when the user click features in the map</p>
Geojson, links and images.
The easiest way to get some data into the map is to head over to geojson.io, and create some content. It also supports images and links in the text box and the way to add images and links is to add some data to the properties object of each geojson feature. Here is a complete properties object with all properties for link, link-title and image-url as they work with this specific map. The properties imgUrl, shortDescr, linkUrl and linkTitle are specific to the newsmap linked at the top of this article and not to Leaflet maps in general.
Also note that the ‘marker-color’ property available on geojson.io is not supported in Leaflet maps. There is an additional tutorial on how to make maps with coloured markers.
"properties": {
                "marker-color": "#7e7e7e",
                "marker-size": "medium",
                "marker-symbol": "",
                "imgUrl": "peppa-pig.png",
                "title": "Peppa-pig",
                "descr": "All the kids around here love Peppa-pig, and most of the adults love Peppa-pig too!",
                "shortDescr": "Who loves Peppa-pig?",
                "linkUrl": "https://www.peppapig.com/?new=peppapig.com",
                "linkTitle": "peppapig.com"
Customizing the map for your audience
This map supports geojson and has some additional properties that can be used to give the reader extra information. It allows you to show only information about the map feature picked by the user, hopefully resulting in a smaller, cleaner and easier to use map. In order for your map to make sense it is important to think how the user will see your map and additional content sucha as images and text. You need to test your own map a lot and it is also a good idea to have someone else try it.
There are six custom properties specified in the newsmap component that we can use to add links, display images and to make titles and decriptions. Here are the properties. Some properties you must have while som are optional. These are the properties you must have:
- descr
- shortDescr
- title
shortDescr is the little text that goes in the pop-up when the user hovers the mouse over a geojson feature (mearker, polygon, plyline etc).
descr is the description the goes in the text box after the user clicks a geosjon feature. The description will be the mist text rich piece of information describing this specific mape feature. If you format this little piece of text well you can really get a lot of information into it. Using line changes is the easiest and often the best way to achieve this. Html text normally takes the space available within the surrounding container and changes lines when there is no more space. But you can force a line change and it is easy, here is how:
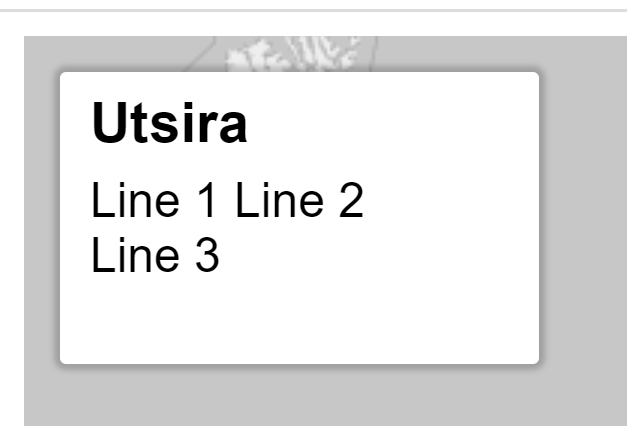
"descr": "Line 1 Line 2 Line 3",The text string value assigned to the ‘descr’ value above will result in the following text box on the Leaflet map:
Here is some code with text changes in the text string. It is as simple as adding \n to the text string:
"descr": "Line 1 \n Line 2 \n Line 3",This results in this textbox on the map:
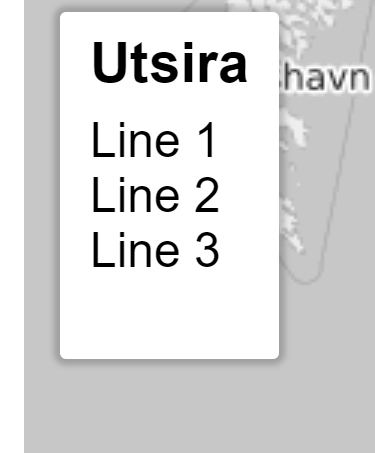
Using line changes with \n within a textstring is a good way to get a tidy text box and hopefully it will be easier to read.
title is the title in the same text box.
Here are som optional properties you can use if you want to add images or links to specific markers.
- linkUrl
- linkTitle
- imgUrl
If you want to add a link to the text box you have to add both the LinkUrl and LinkTitle properties. The linkTitle is simply what the user sees so it should be descriptive. The linkUrl is the actual url. It is best to copy url’s from the adress field in a web browser after you have confirmed that it works (meaning that the page you want to link to loads correctly).
Adding images
The earlier example of the imgUrl property is pointing to an image that exists in the same folder as the Newsmap_Geojson.html file. It looks like this:
"imgUrl": "peppa-pig.png",In order to make this work in WordPress have to put ‘peppa-pig.png’ in the media library. Make sure your file is not too big! Placing image files inside the media library means you are publishing them on the web. Make sure they have an appropriate file size by reducing resolution and applying jpeg compression. Very large images on a server can significantly slow down the site! Images for a use case like this should not be more than 3-400 pixels horizontally, and ideally it should be jpeg compressed to some degree. Here is a guide.
Once our images are scaled and compressed properly we can upload them to the media library. When that is done we need the url for each image so we can set it as a value for the imgUrl properties. With the WordPress installations we have we need to construct the url of the image. It’s not hard, just do this:
In the media library click on each image. You should see a partial url to the image. It will look something like this:
/wp-content/uploads/peppa-pig.pngYou need to attach this bit to the root url of your site. The root url of this site is:
https://gauteheggen.com/So then the complete url becomes:
https://gauteheggen.com/wp-content/uploads/peppa-pig.pngYou can try that in a browser.
So in order for the map to load the relevant image file we get this in the geojson data in newsmap_GEOJSON.html:
"imgUrl": "https://gauteheggen.com/wp-content/uploads/peppa-pig.png",You have to do this for every image you want to show in the map.
Remember that descr, shortDescr and title properties are required for the map to work properly! On the other hand using the imgUrl property for showing images is optional.
Add an iframe to publish
We need to publish our map through an iframe. Here is the code.
<iframe style="border: 0px;" src="https://gauteheggen.com/wp-content/uploads/Newsmap.html" width="1000px" height="420px" scrolling="no"><span data-mce-type="bookmark" style="display: inline-block; width: 0px; overflow: hidden; line-height: 0;" class="mce_SELRES_start"></span>
</iframe>
Consider the precision of your source information before you click publish.
If time is of the essence you might want to publish your map already. Take a few moments before you pull the trigger to reconsider some aspects of what you have made. First you should consider the precision of the source information you have about the geographical location. If a bomb has gone of somewhere and you are making a map about it you don’t want to scare the audience for no reason. If for example you only have a city name you should limit the max zoom level the user can see. Leaflet maps can zoom very far in, but if your source information precision is not down to street level, I don’t think the user should be able to zoom to street level either. This is known as false precision because the map technology allows a much higher level of precision than what is provided in the real information about the event.