In this series I will try to make a recipe for using existing responsive d3js components, and give pointers as to how a regular component can be made responsive. This is work in progress so some components might not be very polished or seem lacking in functionality.
Responsive components should look good on most screen sizes, and especialy the most common ones. These components will have a dynamic width scaling while maintaining a fixed height. In my opinion a fixed height works well in most scenarios but the width has to be dynamic.

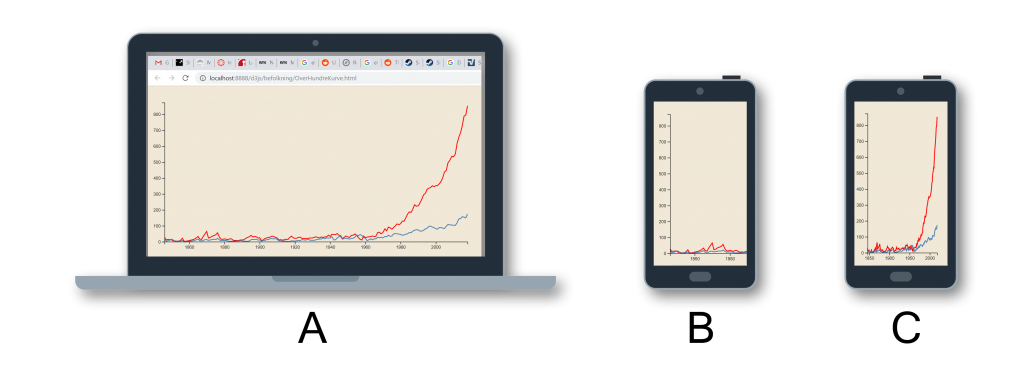
Before starting this series I checked several d3js books but could not find one that focused on responsive components. If you are new to programming and d3.js I reccomend Scott Murray’s book Interactive Data visualization for the web. The book aims at journalists and communicators rather than software engineers and gives a very good introduction to web development as well as d3.js. As with most other d3js books the code examples do not scale well to mobile devices. Most d3 components have scaling issues as illustrated below.
Responsive components
Here is a bar chart from Scott Murrays book. In order to test it open developer tools (F12) and try rescaling the active browser window, and using the mobile preview function.
As you can see this bar chart has a fixed width and will be cropped on mobile screens and narrow browsers. The d3 component can be custom made to a specific width but that is simply not good enough in my opinion. This has led me to develop my own responsive d3 components that scale the width with a fixed height. The width is in my opinion the most important scaling axis, while the height is more flexible as long as your chart is not very tall. Here is the bar chart component that will be covered in this series.
With developer tools open try resizing the width of the browser window. This bar chart also has two defined axes and a tooltip visible on hover. This exact component currently has some code that is specific for the context it was last used in. Stay tuned fro a cleaned and more general barchart component.