If you know nothing about html you should start by reading this tutorial on w3schools or at least read this short but very instructive summary on washington.edu.
The leaflet tutorials linked below are good but they assume prior knowledge of html. This article provides you with a clean, empty html document that you can use to start the Leaflet tutorials while explaining the bare minimum about html. It also has some hidden challenges that we will get to.
The easiest way to make an interactive map that can be published anywhere is to include all html, CSS and javascript in one html document. This works quite well for small projects, but for larger web apps or this method can quickly becomes messy.
Here is the basic html we will use as a starting point. This is copy pasted from the w3schools tutorial linked at the top of this article. When you see text like in the box below this line, you can copy paste it directly into your code editor.
- Highlight and copy all the text in the text box below
- In your code editor, make a new empty document
- Paste the code in your code editor
- Save as a new html file
<!DOCTYPE html>
<html>
<head>
<title>Page Title</title>
</head>
<body>

<h1>This is a Heading</h1>
<p>This is a paragraph.<br>This is the 2nd line of the paragraph.</p>

</body>
</html>
The web page we made with the code above only has two pieces of content and that is a heading and a very short paragraph. If you look at the code above the heading is between<h1> and </h1> tags. The ‘/’ on the last tag means it is a closing tag. HTML structure is built between opening and closing tags and closing tags have a slash. Go to your code editor and highlight different tags to see their opposing closing (or opening) tag. HTML tags can be nested inside each other. Not all html elements have opening and closing tags, som just have one tag and are called non-container tags. There is one such tag on the paragraph above. The <br> tag has one purpose and that is to force a line break. Another example of a non-container tag is an image tag. All content visible in the browser window will nested in the body tags in the html file. In the head section you will find meta information and links to external resources such as style sheets, fonts or javascript libraries such as leaflet and d3.js.
This is the link to the leaflet tutorial
Before you can have your map up and running you need to make a user on mapbox.com. This is so you can get a token to use with your interactive maps. The token is simply a unique generated string that you paste into your leaflet code that identifies your user to the tile provider when a user loads your map. Using map tiles in leaflet is usually free until you reach a specified limit. If a lot of people use your map, mapbox will start charging. If you want to know more about mapbox pricing you will find it here.
The mapbox tiles have just been removed from the code below so it is not necessary to make a mapbox user and leave credit card information anymore.
<!DOCTYPE html>
<html>
<head>
<title>My first map</title>
<meta name="viewport" content="width=device-width">
<!--This load a css file for the map-->
<!--If you want to know more about stylesheeets go to: https://www.w3schools.com/css/ -->
<link rel="stylesheet" href="https://unpkg.com/leaflet@1.5.1/dist/leaflet.css"
integrity="sha512-xwE/Az9zrjBIphAcBb3F6JVqxf46+CDLwfLMHloNu6KEQCAWi6HcDUbeOfBIptF7tcCzusKFjFw2yuvEpDL9wQ=="
crossorigin=""/>
<!-- Make sure you put this AFTER Leaflet's CSS -->
<!--This loads the Leaflet javascript library-->
<script src="https://unpkg.com/leaflet@1.5.1/dist/leaflet.js"
integrity="sha512-GffPMF3RvMeYyc1LWMHtK8EbPv0iNZ8/oTtHPx9/cc2ILxQ+u905qIwdpULaqDkyBKgOaB57QTMg7ztg8Jm2Og=="
crossorigin=""></script>
<style>
#mapid { height: 400px; }
</style>
</head>
<body>
<h1>Mitt kart</h1>
<p>Paragraf.</p>
<div id="mapid"></div>
<script>
//When coding with leaflet 'L' refers to the leaflet mapping library
//This defines the map with a mapid that binds it to the div element above.
//It also runs the setView method of the new map with parameters for lat, lng and zoom level
let map = L.map('mapid').setView([59.928107, 10.749757], 13);
//This sets the tiles to load for the maps tilelayer
L.tileLayer('https://tile.openstreetmap.org/{z}/{x}/{y}.png', {
maxZoom: 19,
attribution: '© <a href="https://www.openstreetmap.org/copyright">OpenStreetMap</a> contributors'
}).addTo(map);
//59.838743, 10.667123
</script>
</body>
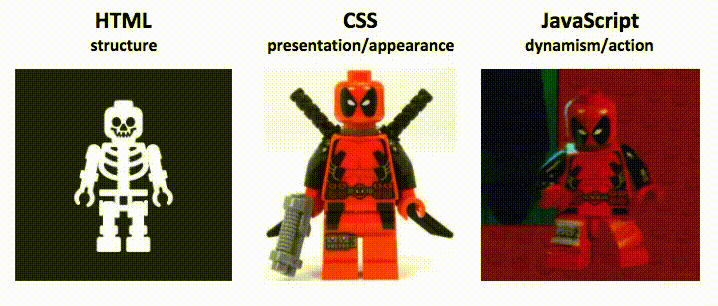
</html>Copy all the code above into your code editor and save it as a html file. In the code editor look for the script tags and look at what is inside. You can see that there are no tags inside the script tag, the code between the script tags looks quite different. That is because this is javascript that is using the leaflet library to make a map. This gif of lego figures is a good metaphor for the three main technologies that make up most web pages.
In this course we will focus mostly on javascript, but we have to be aware of html and css as well. Let’s look a bit closer at some of the code inside the script tags. Here is the first line of the script from line 29 in the html file (The lines starting with // are comments and do not have any function)
let map = L.map('mapid').setView([59.928107, 10.749757], 13);let is a word that is used to declare a variable. You can think of a variable as a name for some data. In this case the variable name ‘map’ is set to be a leaflet map. Leaflet maps use a capital ‘L’. Whenever you want to use a leaflet function you have to type L.function name. In this case the function is to make a new leaflet map and that function is simply called map. The map function takes one parameter, mapid, which is a reference to the html element that the map will be attached to. See if you can find the html element that is going to contain our map. If you need a hint the html type is div. If you need another hint this element has an id called ‘mapid’. Found it? It’s on line 24.
The leaflet map then has one more function called setView. This decides what part of the world should be displayed on the map. The setView function has two parameters. The first parameter is a geographical position defined by latitude (north-south) and longitude (west-east). The second parameter is a number representing the initial zoom level of the map.
We now have a leaflet map called ‘map’, it has a centre and a zoom-level.
<!DOCTYPE html>
<html>
<head>
<title>My first map</title>
<meta name="viewport" content="width=device-width">
<!--This load a css file for the map-->
<!--If you want to know more about stylesheeets go to: https://www.w3schools.com/css/ -->
<link rel="stylesheet" href="https://unpkg.com/leaflet@1.5.1/dist/leaflet.css"
integrity="sha512-xwE/Az9zrjBIphAcBb3F6JVqxf46+CDLwfLMHloNu6KEQCAWi6HcDUbeOfBIptF7tcCzusKFjFw2yuvEpDL9wQ=="
crossorigin=""/>
<!-- Make sure you put this AFTER Leaflet's CSS -->
<!--This loads the Leaflet javascript library-->
<script src="https://unpkg.com/leaflet@1.5.1/dist/leaflet.js"
integrity="sha512-GffPMF3RvMeYyc1LWMHtK8EbPv0iNZ8/oTtHPx9/cc2ILxQ+u905qIwdpULaqDkyBKgOaB57QTMg7ztg8Jm2Og=="
crossorigin=""></script>
<style>
#mapid { height: 400px; }
</style>
</head>
<body>
<h1>Mitt kart</h1>
<p>Paragraf.</p>
<div id="mapid"></div>
<script>
//When coding with leaflet 'L' refers to the leaflet mapping library
//This defines the map with a mapid that binds it to the div element above.
//It also runs the setView method of the new map with parameters for lat, lng and zoom level
let map = L.map('mapid').setView([59.928107, 10.749757], 13);
//This sets the tiles to load for the maps tilelayer
L.tileLayer('https://tile.openstreetmap.org/{z}/{x}/{y}.png', {
maxZoom: 19,
attribution: '© <a href="https://www.openstreetmap.org/copyright">OpenStreetMap</a> contributors'
}).addTo(map);
//59.838743, 10.667123
</script>
</body>
</html>Further down in the code (line 34) you can see another leaflet function called L.tileLayer. This function specifies what map tiles will be used for our map. We will look at using different map tiles at a later stage. We don’t need to discuss all the properties of the tile layer right now, but notice that it ends with a function.
This means that the tiles and all its properties should be attached to our map which is named ‘map’. If it said something else in the addTo function the tiles would not attach themselves to our map but to another element.
Use code from the Leaflet tutorial in the map
The next step is to go to the markers, circles and polygons section of the leaflet tutorial to work inside our blank map. There is code for three different kinds of map elements. In order for these chunks of code to work it is important to place them correctly within the html file. We are copying javascript so it is going inside the script tags, but it also matters where we place them in the script tag. Paste the code for the map elements after the code for the tileLayer. Save the html file and open it in a web browser.
Yes, you are still looking at a blank map. We have just pasted some code from another project into our project and what often happens when copy pasting code is nothing, or even worse it could break our project. Let’s find out what’s wrong with our code. I recommend using either google chrome or mozilla firefox for the following part. We will use some tools that are built into these web browsers to look for errors. You can either right click on the web page and choose ‘inspect’, or use a short key. For windows use either F12 or Ctrl + Shift + i. On a Mac use Cmd + Shift + i.
Once developer tools (dev-tools from now) is open you will see a panel either on the right hand side of the screen, or at the bottom. Do you see a red message indicating an error? If not try to click on the ‘console’ tab of developer tools. Do you see it now? Does this ring a bell?
Error messages are great because they can lead you straight to the source of the problem.
Do you remember that we gave our map a name? Do you remember that the tile code attached itseld to our map using our maps name? We have copied code frmo another leaflet map project, but because the name of the map in that project is different the code we have pasted in produces an error message. Error messages are great because they will often lead you straight to the source of the problem. If you ever see an error message that does not make sense to you you should google it.
The error message we are getting here is an ‘uncaught referenceError’. It means that we have used a variable name that does not exist in our script. This is one of the most common and basic errors and understanding why it happens is important. So, the solution is simple. The pasted code uses ‘mymap’ as a variable name, we used ‘map’. Change ‘mymap’ to ‘map’ and it should work. Save the html document and look at it in a browser.
A blank map, great!
This time the code should work. You can check dev-tools again to make sure there are no errors. If ou find an error try to figure it out. If you don’t have errors you can start zooming out the map until you see the United Kingdom. Is there a marker, a circle or a polygon?
Try to complete the rest of the leaflet tutorial by pasting the code into our html document. Remember to put it inside the script tags after the map declaration (let map = ….) and after the tilelayer function. You will get the ‘uncaught referenceError’ again each time if you forget to change the map variable name.
All the elements from the leaflet tutorial are placed in London. Try to play around with the geographical coordinates of the different elements and see if you can place them inside the scope of the map when it opens, which in our example is Oslo.
Here is a complete map with the marker and circle elements and the popup stating the geographical coordinates where the user clicks.