This article will show you how to add coloured markers in the newsmap component. It will aslo go a bit deeper in to the inner workings of the newsmap component since we need to change the component itself so it can display the different coloured markers. This explanation is meant for you to learn how to modify your existing newsmap project. If you just want the newsmap geojson file with support for coloured markers it is at the bottom of the page.
First of all, you can not choose any color in the geojson.io interface and get that colour on your marker in the newsmap component. We have to use a seperate solution to get coloured markers in our map. A lot of students are a bit confused about the difference between the data format geojson and the online tool geojson.io. Geosjon is a standardized structured data format for geodata. Geojson.io is a online tool for making geojson data, but that does not mean that every feature in the geojson.io tool will work in any map solution that can display geojson data. Leaflet maps for example do not have a method for changing marker colour so when you choose a marker colour in geojson.io it still show up blue in the newsmap and other Leaflet maps that support geosjon.
In order to get coloured markers in a Leflet map we need to make custom markers. To learn about Leaflet.js and custom markers in general you can look at this tutorial:
https://leafletjs.com/examples/custom-icons/
With custom markers you can use any image as a marker icon to make your markers look like whatever you want. Technically that means you could have any colour from geojson.io, but you would need one uploaded image for each individual colour and with 16.7 million colours that is a lot of images to upload on a server. It’s better to choose from few a coloured markers that are already online:
https://github.com/pointhi/leaflet-color-markers
Just to be clear, you can upload your own images to the wordpress media library and use those as marker icons. If you for example wanted som different colours you could put them online through your own wordpress site. That might be covered in a future update to this article, but right now it will focus on using the existing and published markers from the link above.
On the github page linked above there are images of the markers and then some sample code to get a marker in to your own project. We will have to adapt this code to fit within our project. Do not simply copy paste the following code in to your project, it won’t work without some adjustments:
var greenIcon = new L.Icon({
  iconUrl: 'https://raw.githubusercontent.com/pointhi/leaflet-color-markers/master/img/marker-icon-2x-green.png',
  shadowUrl: 'https://cdnjs.cloudflare.com/ajax/libs/leaflet/0.7.7/images/marker-shadow.png',
  iconSize: [25, 41],
  iconAnchor: [12, 41],
  popupAnchor: [1, -34],
  shadowSize: [41, 41]
});

L.marker([51.5, -0.09], {icon: greenIcon}).addTo(map);
This will add a greenIcon that can be used with any marker. The second part of the code (starting with L.marker…) creates a marker on the map using the green icon. We don’t want the marker, just the icon. Later we will add the icons we want to the markers in a part of the script where markers are made from geosjon data. More on that later.
First of all you need to make one icon for each extra colour you want to use. That means making a new variable name for each icon, and then changing the iconUrl link to the image so it links to the image with the corresponding colour. If you wan to change green to orange you would change this:
iconUrl: 'https://raw.githubusercontent.com/pointhi/leaflet-color-markers/master/img/marker-icon-2x-green.png',to this…
iconUrl: 'https://raw.githubusercontent.com/pointhi/leaflet-color-markers/master/img/marker-icon-2x-orange.png',And the variable name needs to be unique so we will change var = greenIcon to var= orangeIcon. This is the entire code to make an orange icon. The only 2 changes are the variable name and the filname ‘marker-icon-2x-orange.png’. Make the same changes in every custom icon you want to use.
var orangeIcon = new L.Icon({
  iconUrl: 'https://raw.githubusercontent.com/pointhi/leaflet-color-markers/master/img/marker-icon-2x-orange.png',
  shadowUrl: 'https://cdnjs.cloudflare.com/ajax/libs/leaflet/0.7.7/images/marker-shadow.png',
  iconSize: [25, 41],
  iconAnchor: [12, 41],
  popupAnchor: [1, -34],
  shadowSize: [41, 41]
});
Here are all the colours supported for this solution:
blue
gold
red
green
orange
yellow
violet
grey
black
Add the color property in to the geojson data
It was mentioned before, but we can not use the existing color picker tool in geojson.io. We can use any of the 9 colors above or start making our own coloured icons. That might be covered in a future update. For now lets get the nine different coloured markers working. The property for custom colour will be called customColor. By the way I write ‘colour’ the british way in texts, but in code I try to always write ‘color’ because that is common practice.
So, the property name for this is customColor. In geojson.io that might look like this:
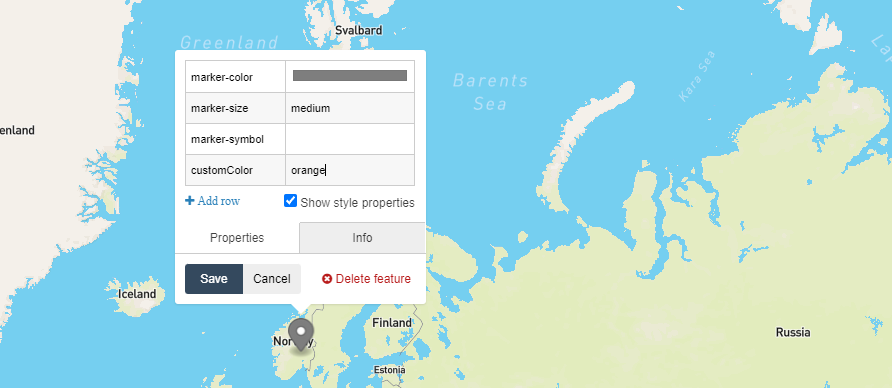
In some geojson code it would look like this (only showing one feature, not the netire geojson data):
{
  "type": "FeatureCollection",
  "features": [
    {
      "type": "Feature",
      "properties": {
        "marker-color": "#7e7e7e",
        "marker-size": "medium",
        "marker-symbol": "",
        "customColor": "orange"
      },
      "geometry": {
        "type": "Point",
        "coordinates": [
          10.1953125,
          60.58696734225869
        ]
      }
    }
  ]
}
You can see that this geojson feature has both marker-color and custom-color properties, but only the custom-color propert will matter in our map.
Changes in the newsmap component
In the map component we first have to make one custom icon for each color as described above. That means adding one of these for each color. There are two instances of colour names in this code that must be changed for each icon and the details are described further up.
var greenIcon = new L.Icon({
  iconUrl: 'https://raw.githubusercontent.com/pointhi/leaflet-color-markers/master/img/marker-icon-2x-green.png',
  shadowUrl: 'https://cdnjs.cloudflare.com/ajax/libs/leaflet/0.7.7/images/marker-shadow.png',
  iconSize: [25, 41],
  iconAnchor: [12, 41],
  popupAnchor: [1, -34],
  shadowSize: [41, 41]
});
In the news map file with color (Linked at bottom of page) you will find nine of these starting around line 181.
We also need to add each idon the the corresponding marker. That happens like this:
let layerGroup = L.geoJSON([], {
                onEachFeature: function (feature, layer) {
                    var props = feature.properties;
                    layer.bindTooltip(props.shortDescr);
                    layer.on({
                    click: markerClicked
                    });
                    if (props.customColor){ // checks if there is a property for customColor
                      if (props.customColor == 'green'){
                        layer.setIcon(greenIcon);
                      } else if (props.customColor == 'orange'){
                        layer.setIcon(orangeIcon);
                      } else if (props.customColor == 'red'){
                        layer.setIcon(redIcon);
                      } else if (props.customColor == 'blue'){
                        layer.setIcon(blueIcon);
                      } else if (props.customColor == 'gold'){
                        layer.setIcon(goldIcon);
                      } else if (props.customColor == 'yellow'){
                        layer.setIcon(yellowIcon);
                      } else if (props.customColor == 'violet'){
                        layer.setIcon(violetIcon);
                      } else if (props.customColor == 'grey'){
                        layer.setIcon(greyIcon);
                      } else if (props.customColor == 'black'){
                        layer.setIcon(blackIcon);
                      }

                    }

                    layer.title = props.title;

                    layer.descr = props.descr;

                }
            }).addTo(map);
You can see that within the onEachFeature loop there are if statements checking the customColor property and then adding the right icon. That’s all for now.
Here is the file so with this you can start a fresh project and you just need to add geojson with correct customColor properties for coloured markers.